Banking churn service
BankChurn Predictor
Predict which bank customers are likely to leave — and quantify the cost of getting it wrong.
The Problem
A bank with 100K customers and a 20% annual churn rate loses ~$30M/year in lifetime value. The question isn't "can we predict churn?" — it's "at what threshold do we act, and what does each error cost?"
Business Translation
Problem
Retention budget is limited
The useful question is which customers deserve intervention, not whether the model can produce a score.
Decision
Favor recall with a lower threshold
A missed churner is much more expensive than an unnecessary retention offer, so the threshold is tuned around cost of error.
Impact
Predictions become operational
The output supports action: probability, risk category, threshold rationale and explanation path.
Trade-off
More complexity for explainability
The ensemble improves performance, but it requires careful SHAP handling and serving-path discipline.
Why AUC-ROC, Not Accuracy
The dataset is 80/20 retained/churned. A model predicting "no churn" for everyone scores 79.6% accuracy — and catches zero churners. AUC-ROC measures rank-ordering quality across all thresholds, independently of class imbalance.
| Metric | Value | Why It Matters |
|---|---|---|
| AUC-ROC | 0.87 | Rank-ordering: 87% of the time, a churner scores higher than a non-churner |
| F1 | 0.62 | Harmonic mean at default threshold (0.50) |
| Precision | 0.73 | 73% of flagged customers actually churn |
| Recall | 0.54 | 54% of actual churners caught (at 0.50); 78% at production threshold 0.35 |
Production threshold: 0.35 — a missed churner costs ~$1,500 LTV; an unnecessary retention offer costs ~$50. At 30:1 cost ratio, we favor recall over precision.
Architecture
flowchart LR
    A[API Request] --> B[Pydantic\nValidation]
    B --> C[ColumnTransformer]
    C --> D{StackingClassifier}
    D --> E[RandomForest]
    D --> F[GradientBoosting]
    D --> G[XGBoost]
    D --> H[LightGBM]
    E & F & G & H --> I[LogisticRegression\nMeta-Learner]
    I --> J[Prediction +\nRisk Level]
    J --> K{explain=true?}
    K -->|Yes| L[SHAP Values\n+93ms]
    K -->|No| M[JSON Response\n~103ms]
    L --> M
Why StackingClassifier: 4 diverse base learners capture complementary patterns (bagging + boosting + tree + gradient). AUC improved from 0.84 (best single model) to 0.87. CV variance is tight (±0.006), confirming generalization over memorization. See ADR-003.
Engineering Trade-Off
Chosen: StackingClassifier + FastAPI serving + async executor pattern. Rejected: a simpler single-model API that would be easier to serve but less useful as a portfolio signal for ensemble modeling, explainability and inference-path debugging.
The StackingClassifier also forced a concrete explainability fix: TreeExplainer produced unusable all-zero outputs for this ensemble/pipeline shape, so the service moved to KernelExplainer through a predict-proba wrapper in the original feature space.
Code Review Shortcuts
Operational
| Metric | Value | Context |
|---|---|---|
| Test Coverage | 90% (199 tests) | CI threshold: 85% |
| Docker Image | 342 MB | bankchurn:v3.6.0 on Artifact Registry (python:3.11-slim-bookworm) |
| Model Size | 4.1 MB | Joblib compress=3; includes preprocessor + 4 base learners + meta-learner |
| P50 / P95 Latency | 200ms / 410ms (GCP), 110ms / 140ms (AWS) | Through ingress, Locust smoke test (6 users) |
| SHAP | Lazy, CPU-only | ?explain=true adds ~4.5s (KernelExplainer); skipped by default |
| HPA correction | Memory -> CPU-only | Replicas reduced from 3 to 1 in 8 minutes after rejecting memory as the scaling signal |
Responsible AI
- Fairness: Disparate impact ratio and equal opportunity difference audited by Gender and Geography
- Drift: Evidently AI monitors PSI/KS per feature; alert fires if >30% features drift
- Validation: Pandera schemas reject invalid inputs (CreditScore ∈ [300, 850], Age > 0)
Live Prediction
| BankChurn Prediction | SHAP Explanation |
|---|---|
 |
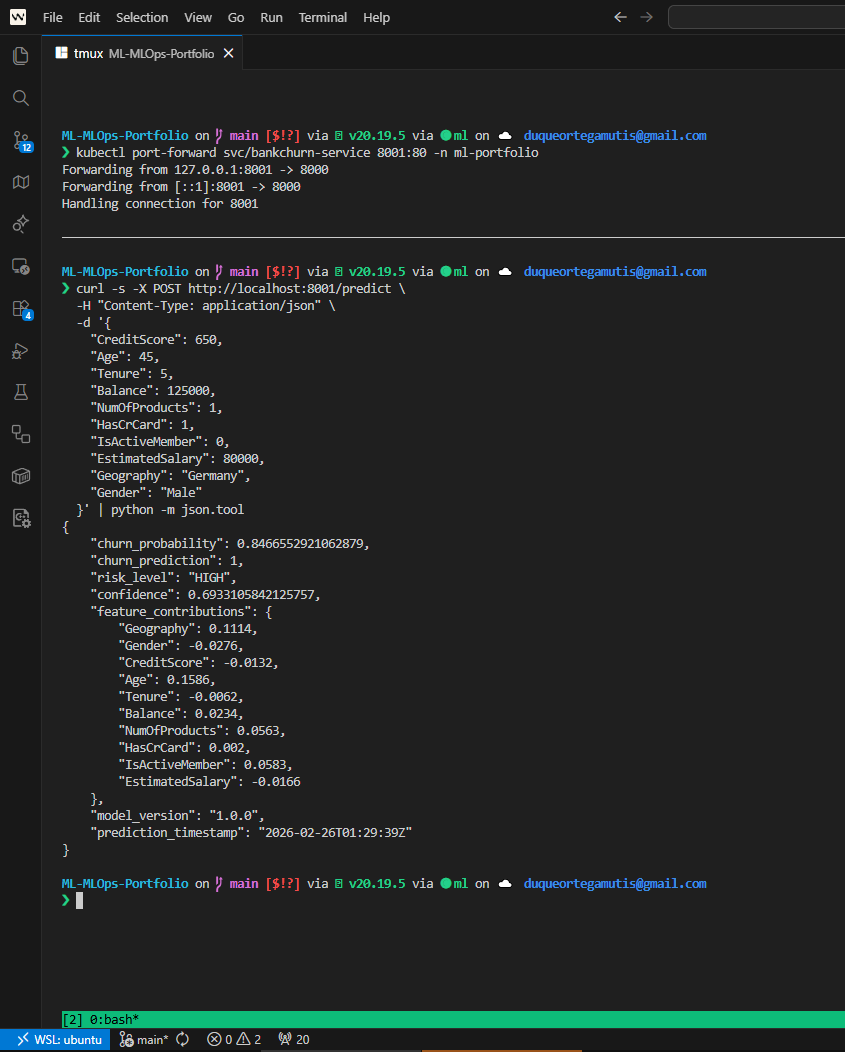 |
Try It
curl -s -X POST http://localhost:8001/predict \
  -H "Content-Type: application/json" \
  -d '{"CreditScore":650,"Geography":"France","Gender":"Male","Age":40,"Tenure":5,"Balance":60000,"NumOfProducts":2,"HasCrCard":1,"IsActiveMember":1,"EstimatedSalary":50000}' | python3 -m json.tool
Expected: churn_probability, risk_category (low/medium/high), churn_prediction (0/1)
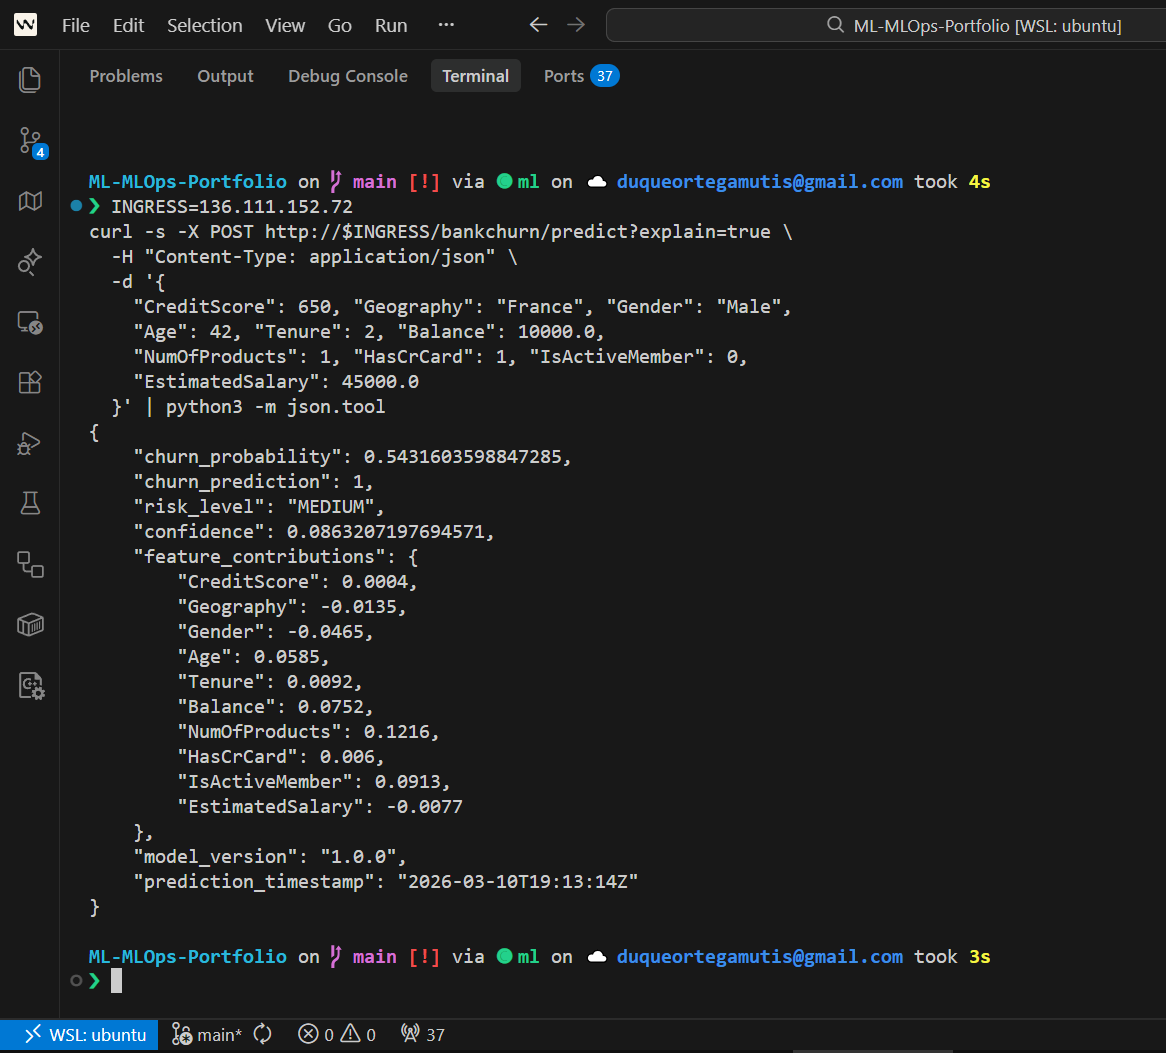
curl -s -X POST "http://localhost:8001/predict?explain=true" \
  -H "Content-Type: application/json" \
  -d '{"CreditScore":450,"Geography":"Germany","Gender":"Female","Age":55,"Tenure":1,"Balance":0,"NumOfProducts":1,"HasCrCard":0,"IsActiveMember":0,"EstimatedSalary":30000}' | python3 -m json.tool
Expected: Same fields + feature_contributions (SHAP values per feature). This high-risk customer should show Age and NumOfProducts as top churn drivers.
📄 Full Model Card — includes metric rationale, performance benchmarks, and production decision narrative.
Related Operating Evidence
Last Updated: April 2026 — v3.6.0